NeurIPS 2026

FoMo Forking Moment in Generative Trajectory as a Perceptual Distance

Jaihyun Lew, Mingi Jung, Minjun Park, Wooseok Song, Sungroh Yoon†

DSAIL, Data Science & AI Laboratory Seoul National University
†Corresponding author
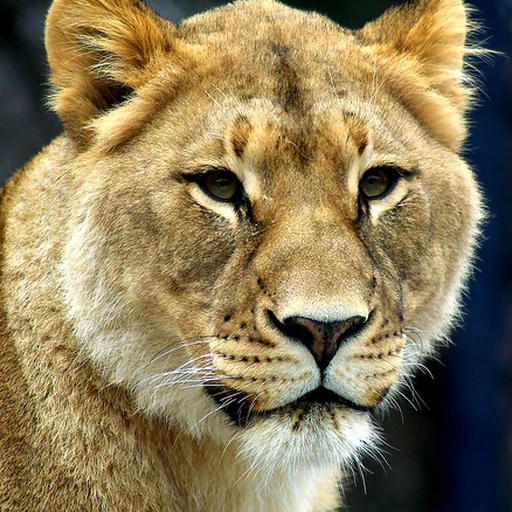
Pick a forking step
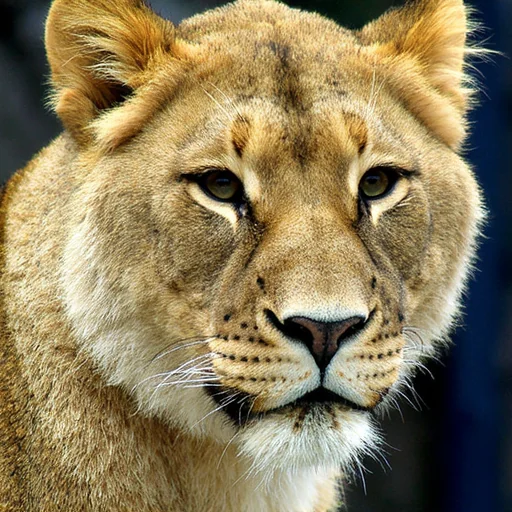
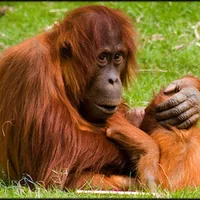
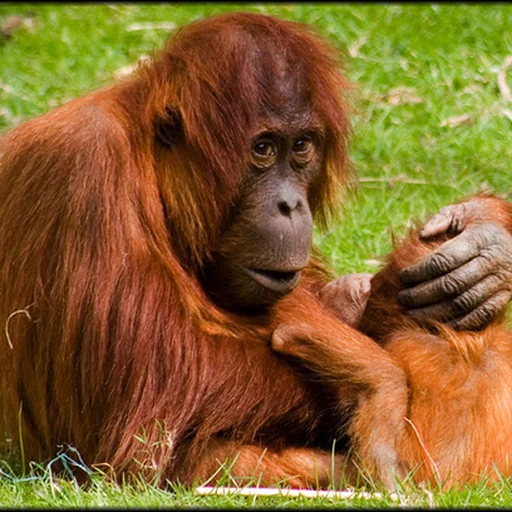
Reference image
Reference
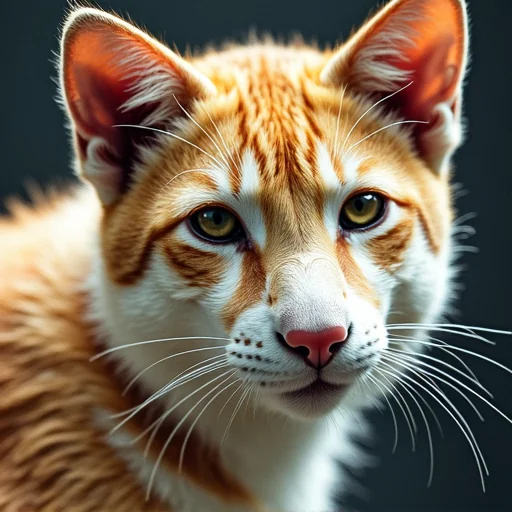
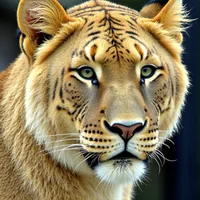
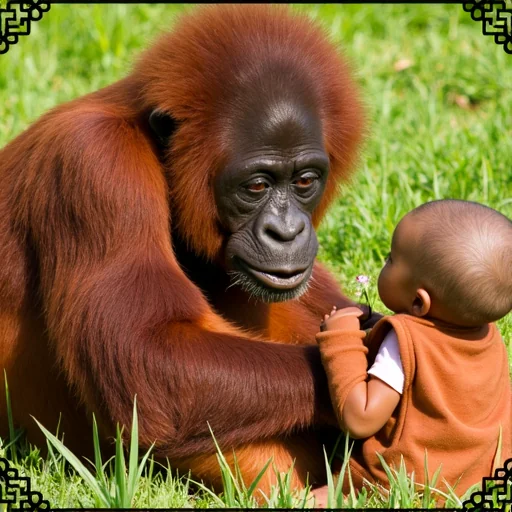
FLUX variant of the reference, forked at step 15
s = 15
Fork early: farFork late: close

Structure survives, content changes

A distance label from the generator itself

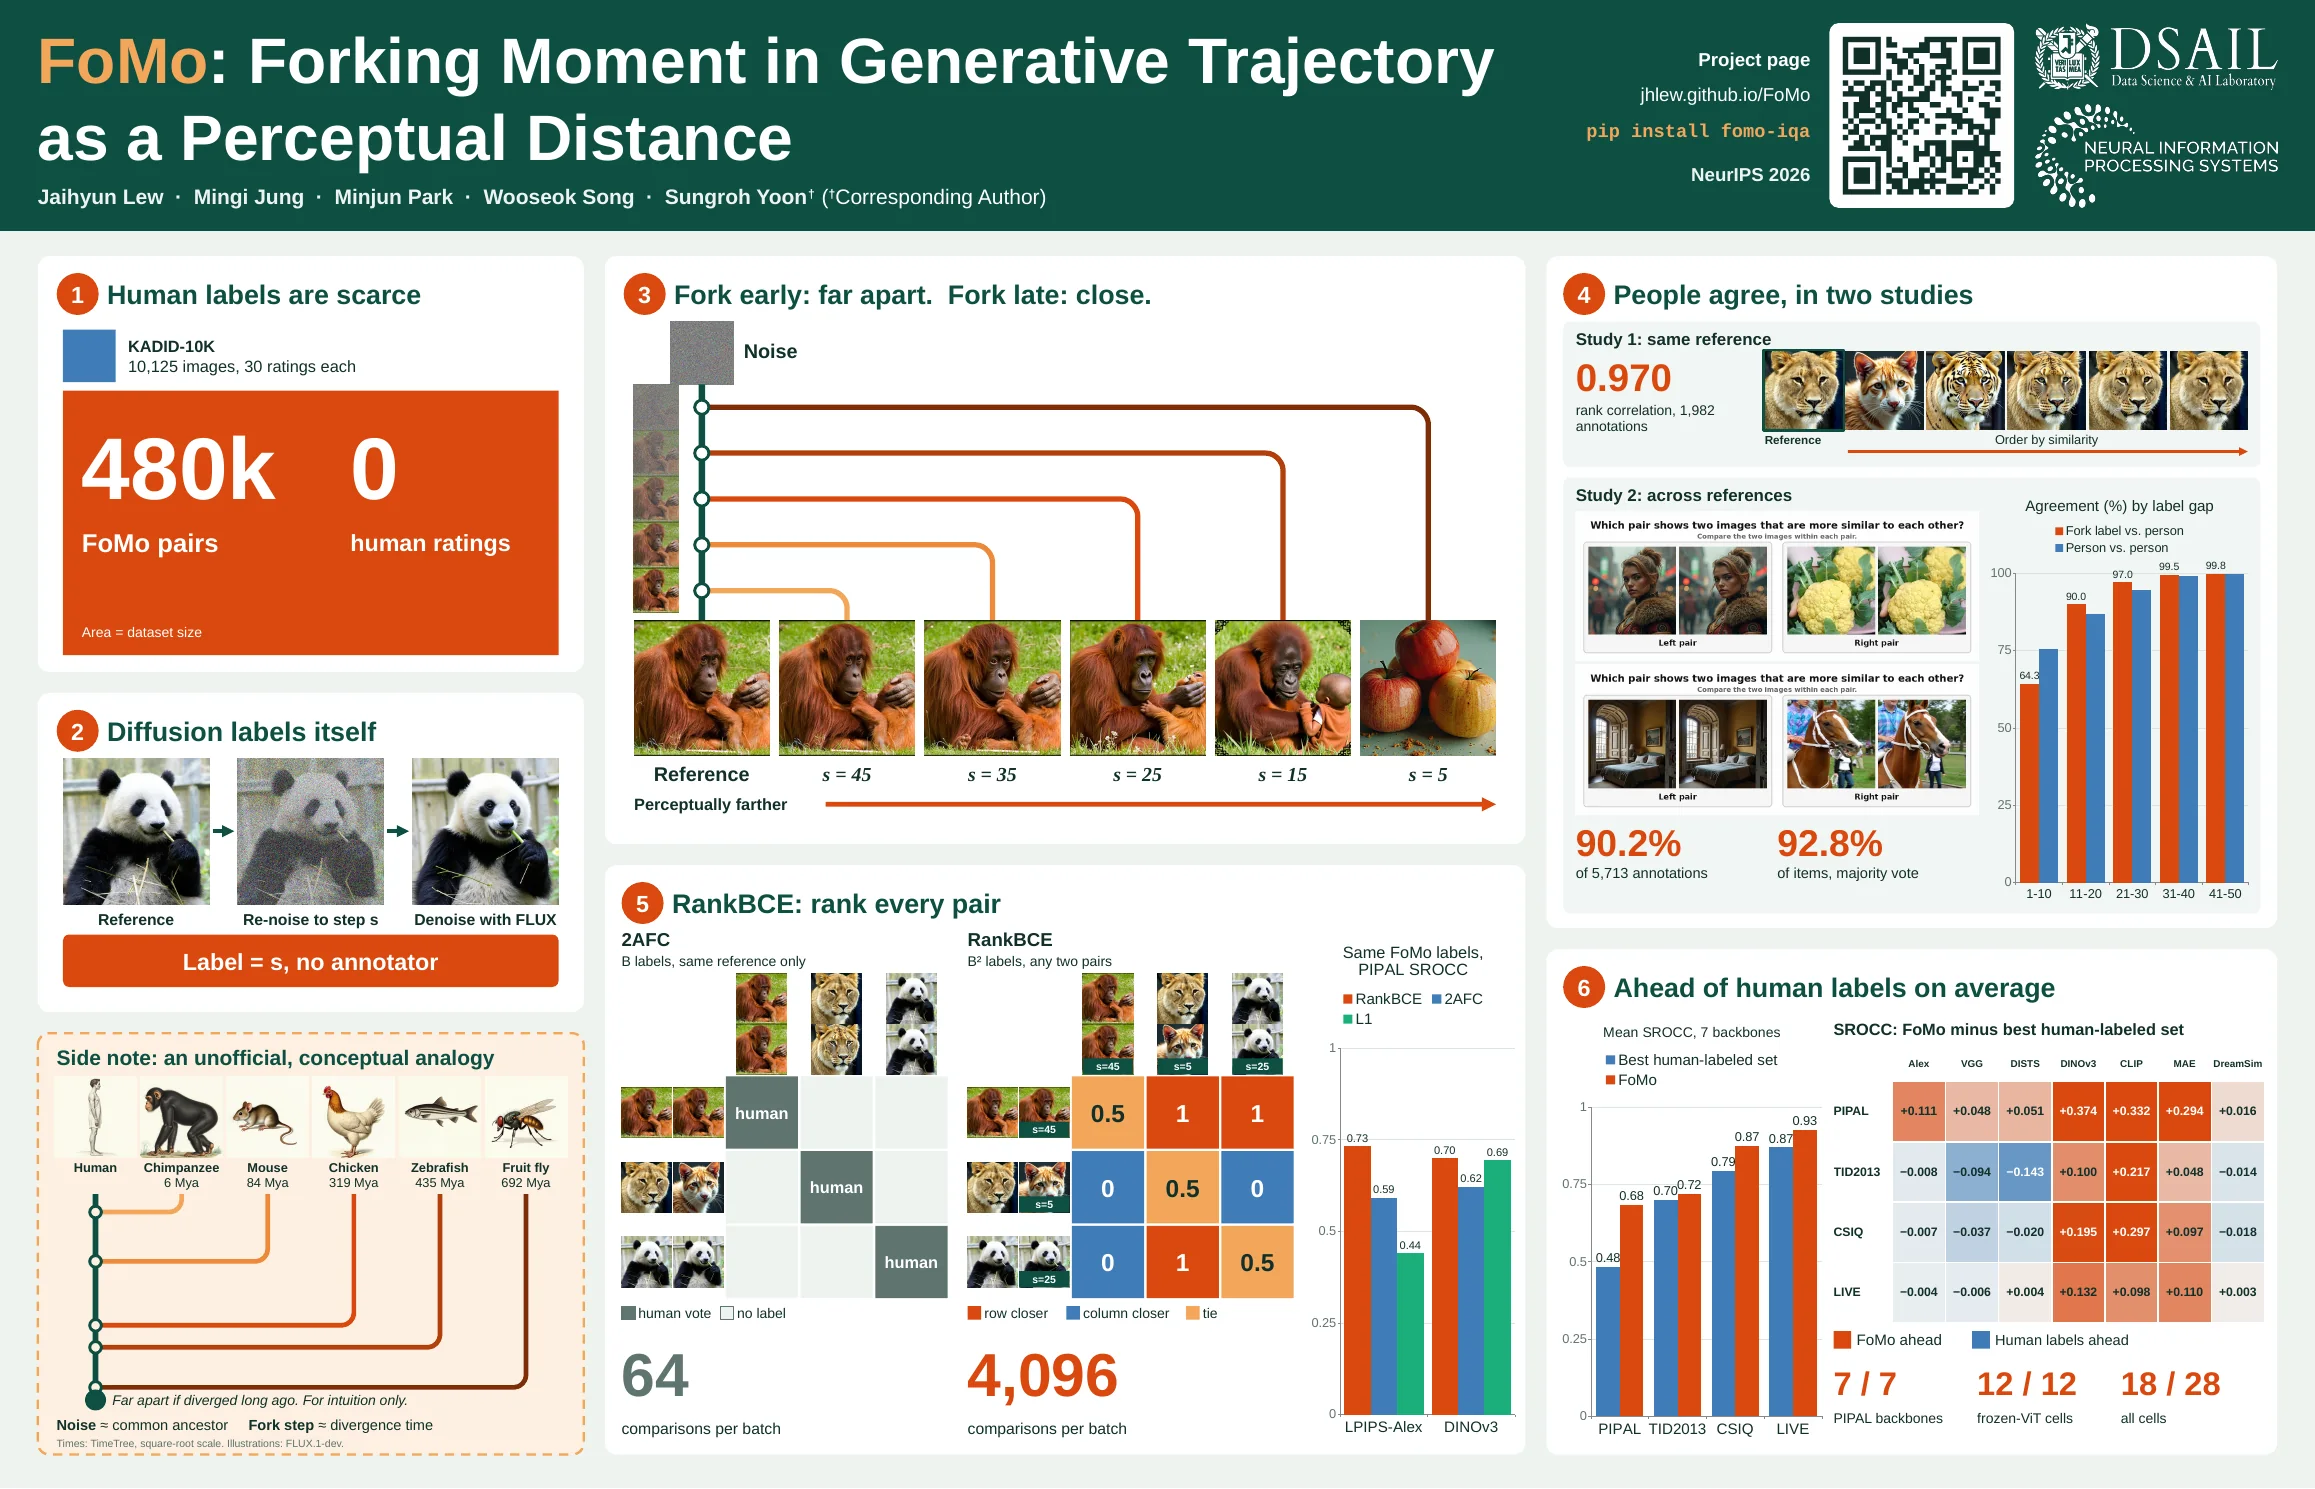
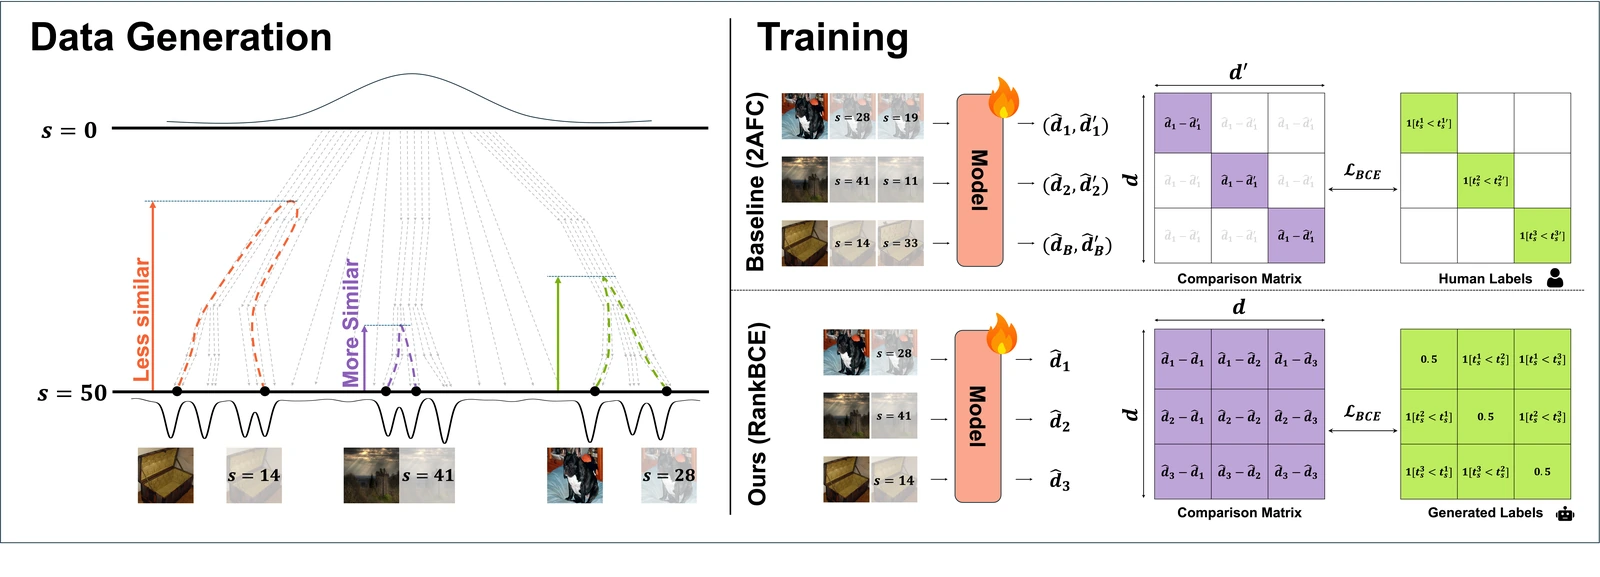
Perceptual metrics normally learn from people, and human labels are expensive, noisy and hard to compare across images. A diffusion model already builds images coarse-to-fine, so we use that order. Re-enter the trajectory at step s and generate again. Fork late and only fine detail changes. Fork early and only coarse structure survives. The forking step is the distance label.

We generated 480,000 labelled pairs with FLUX and no annotators. Because every pair carries its own label, any two pairs in a batch can be compared, so the model learns a global ranking and not only a choice within one reference.

From forks to a trained metric

Left: trajectories fork from noise, and a later fork gives a more similar image. Right: 2AFC training compares two variants of one reference, while RankBCE compares every pair in the batch.

People agree, in two studies

Study 1: same reference

Raters ordered five forks of one image by similarity to it.
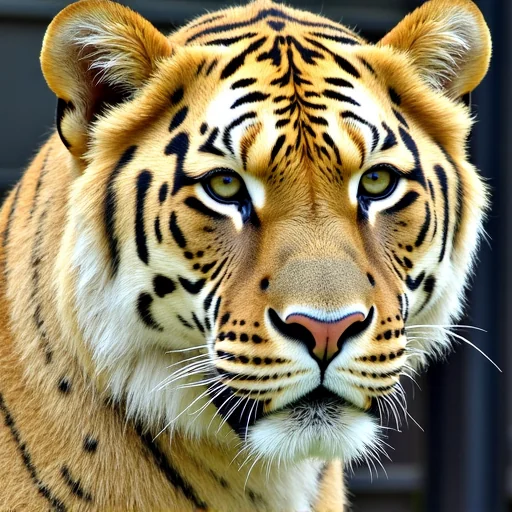
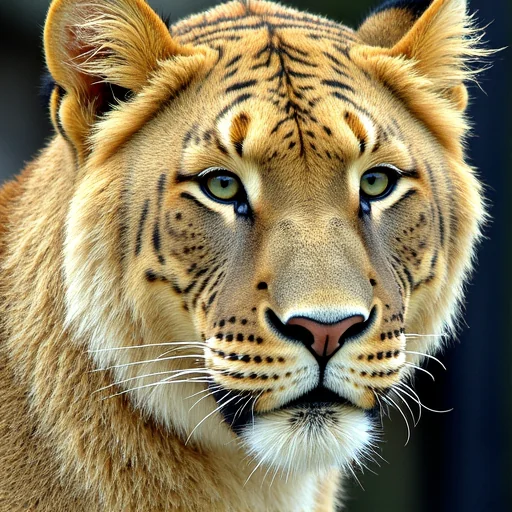
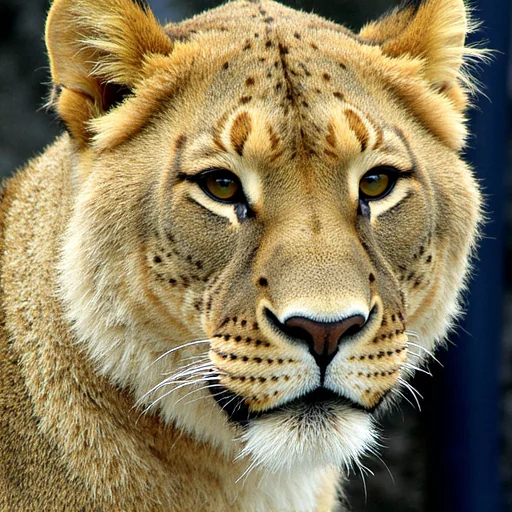
Example reference Example fork, s = 5 Example fork, s = 15 Example fork, s = 25 Example fork, s = 35 Example fork, s = 45

Reference (outlined), then forks from least to most similar. Example images.

0.970
rank correlation with the fork order, 1,982 annotations
Study 2: across references

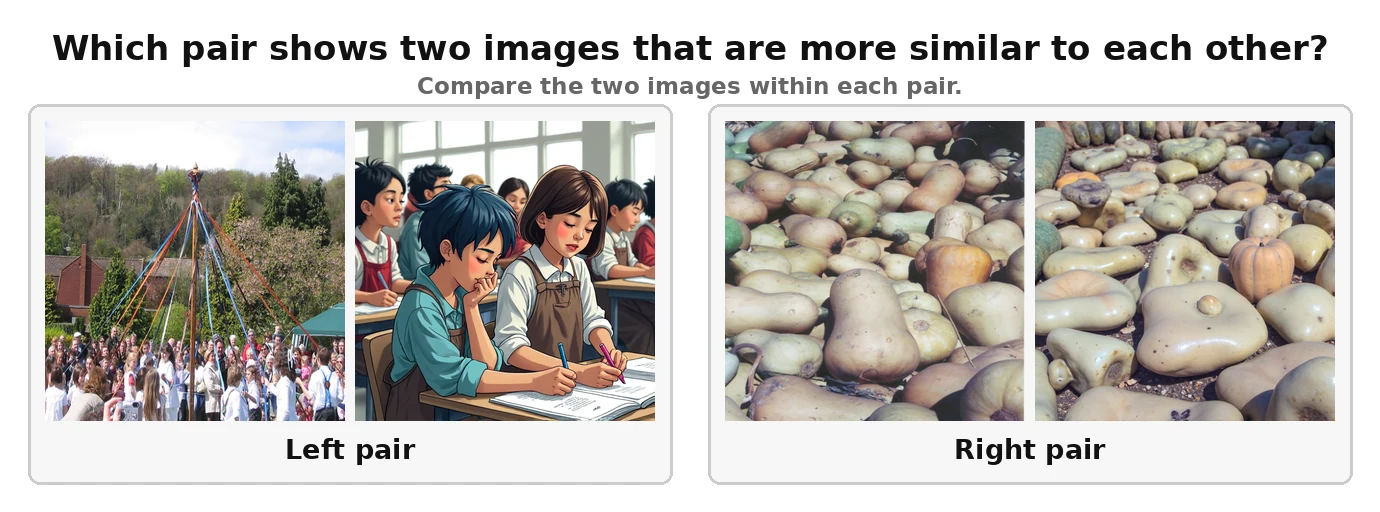
Raters chose which of two pairs, from different references, looked more alike.

90.2%
of 5,713 annotations agree
92.8%
of items, by majority vote
Fork label vs. personPerson vs. person
1-1011-2021-3031-4041-50

Agreement (%) by gap between the two labels, in steps. The label is weakest exactly where people disagree with each other.

Try a real Study 2 item

Two image pairs. Which pair shows two images more similar to each other?
Which pair looks more alike to you?

RankBCE: rank every pair

A 2AFC label only says which of two variants of one reference is closer. Our labels are pointwise, so every pair can be compared with every other pair, even across references.

2AFC

B labels, same reference only

human
human
human
human voteno label
64
comparisons per batch

RankBCE

B² labels, any two pairs

s=45
s=5
s=25
s=45
0.5
1
1
s=5
0
0.5
0
s=25
0
1
0.5
row closercolumn closertie
4,096
comparisons per batch

Same FoMo labels, different loss

PIPAL SROCC. RankBCE is never beaten; on DINOv3 it matches L1 within seed variation.

LPIPS-Alex
RankBCE
0.733
2AFC
0.592
L1
0.440
DINOv3
RankBCE
0.699
2AFC
0.622
L1
0.694

Results

Each row trains the same seven models on a different dataset, so only the supervision changes. FoMo is the only row with no human labels. Scores are mean SROCC over 5 seeds, and higher is better.

7 / 7backbones lead on PIPAL
12 / 12frozen-ViT cells lead
18 / 28of all cells lead
Trained onObjectiveLPIPS-AlexLPIPS-VGGDISTSDINOv3CLIPMAEDreamSim†Avg.
BAPPS2AFC0.6220.6340.4890.2870.1510.3380.7600.469
PieAPP2AFC0.6020.6350.5640.3250.2580.2940.7110.484
NIGHTS2AFC0.5770.545−0.2940.2340.2770.2340.6610.319
KADID-10KL10.5770.5900.5180.2980.3120.2530.6170.452
FoMo (ours)RankBCE0.7330.6830.6150.6990.6440.6320.7760.683

Best in each column is highlighted. †Non-frozen backbone.

Use it

pip install fomo-iqa

import fomo

metric = fomo.FoMo('dinov3')
d = metric(img_ref, img_test)        # lower = more similar

# as a perceptual loss
loss = metric(prediction, target, output='loss').mean()
loss.backward()

Citation and poster